NET NEW REVENUE FROM NEW VS. EXPANSION
SaaS AI Startups AI in Southeast Asia SEA 3 Minutes
As SaaS Companies Grow, Expansion Revenue Takes Center Stage
A new snapshot of SaaS performance shows a consistent, and consequential, shift in how software companies generate revenue as they scale. According to the 2024 SaaS Benchmarks Report by High Alpha, smaller SaaS businesses rely overwhelmingly on new customer acquisition, while larger, more mature companies lean far more on revenue expansion from existing customers.
The headline shift
High Alpha’s data tracks the split between new ARR vs. expansion ARR across company sizes. For companies with less than $1M in ARR, a striking 90% of revenue typically comes from new customers, with only 10% from expansion. That mix changes steadily as ARR rises:
-
$1–5M ARR: ~75% new / 25% expansion
-
$5–20M ARR: ~77% new / 29% expansion
-
$20–50M ARR: 65% new / 35% expansion
-
Greater than $50M ARR: 65% new / 35% expansion

The takeaway is clear: once companies cross roughly the $20M ARR threshold, about 35% of total ARR at the median comes from existing customers, upsells, cross-sells, seat growth, usage, and pricing/packaging effects. For leaders managing later-stage growth, expansion is not a nice-to-have lever; it’s a central growth engine.
(Source: 2024 SaaS Benchmarks Report by High Alpha.)
Why the mix changes with scale
Several operational realities drive this pattern:
-
Market penetration and CAC pressure. As companies grow, they’ve often tapped the “easiest” segments of their market. New-logo acquisition becomes more expensive, and payback periods lengthen. Expansion, selling more to customers who already trust the product, offers a more efficient route to durable growth.
-
Product maturity and breadth. Mature companies typically launch additional modules, tiers, and integrations. That creates natural cross-sell paths and increases the surface area for usage-based growth.
-
Customer success as a growth function. Larger organizations are more likely to have dedicated customer success, revenue operations, and lifecycle marketing teams. Those functions professionalize onboarding, drive adoption, and systematize expansion motions.
-
Pricing power. With stronger product-market fit and clearer ROI, later-stage companies can more confidently introduce packaging changes and value-based pricing, lifting net revenue retention (NRR).
What this means for operators at each stage
Early-stage (<$5M ARR):
Keep the main thing the main thing: new logos. The benchmark suggests most revenue will come from new customers, so founders should prioritize pipeline generation, repeatable sales process, and crisp ICP definition. That said, stand up the basics of customer success early, implementation speed and activation are leading indicators for future expansion.

Growth-stage ($5–20M ARR):
This is the transition zone. Expansion begins to matter, approaching 25–29% of ARR in the median case. Invest in product telemetry, health scoring, and structured QBRs. Ensure packaging and entitlements create clear ladders for customers to climb. Start tracking NRR and GRR with the same rigor as new ARR.

Later-stage ($20M+ ARR):
With ~35% of ARR from existing customers at the median, expansion becomes a pillar. Mature teams weave together CS, sales, product, and finance around expansion targets: upsell quotas, adoption milestones, and cohort-based NRR goals. Pricing and packaging reviews become annual rituals, ideally supported by willingness-to-pay research and usage analysis.
Metrics that matter
-
Net Revenue Retention (NRR): A composite metric capturing expansion, contraction, and churn. Best-in-class SaaS at scale often targets NRR ≥ 120% (sector- and pricing-model-dependent).
-
Expansion ARR Ratio: Track expansion as a share of total ARR to benchmark against peers and spot motion gaps.
-
Time-to-Value and Adoption: Leading indicators for future expansion; shorten onboarding, instrument activation, and celebrate early “aha” moments.
Strategic implications
For boards and finance leaders, this benchmark pattern affects planning. Pipelines and budgets that overweight new logos at later stages can misallocate go-to-market spend. Conversely, underfunding customer success, lifecycle marketing, and data infrastructure can cap expansion potential. The steady climb from 10% to 35% expansion ARR, as ARR grows, underscores the need to design for expansion early, even if it won’t dominate the P&L until later.
If your 2025 plan leans on expansion ARR, let’s make it deliberate. Book a short intro call and pressure-test your growth strategy with us.

Related Posts
-

Retail Investors AI Startups Southeast Asia 4 Minutes
Polarlyst: The Thai AI “Co-Pilot” Bringing Institutional-Style Research to Retail Investors
Polarlyst is a Thai AI-driven investing “co-pilot” turning complex financial data into clear, actionable insights for retail investors. In this WOWS Global spotlight, we break down why they stand out, why they’re worth watching, and what their rise says about the next wave of WealthTech in Southeast Asia. -
Fintech SEA AI Startups Early Stage 5 Minutes
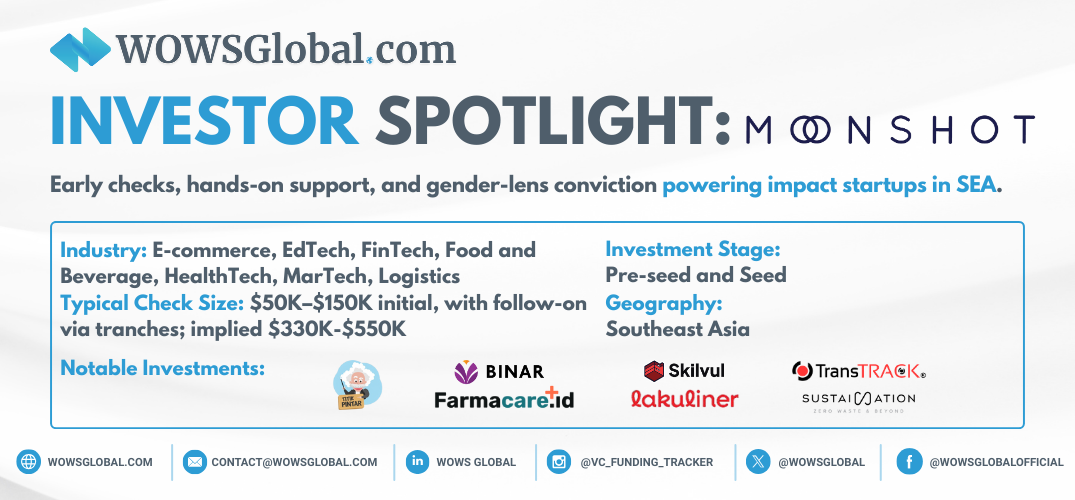
Moonshot Ventures: Betting Early on Southeast Asia’s Purpose-Driven Builders Starting with Women-Led Innovation in Indonesia
Moonshot Ventures invests early in Southeast Asia’s most mission-driven founders, pairing capital with deep operating support. Through IWEF, it’s helping women-led innovation in Indonesia scale with a tranche-based model and a strong partner network. -

Capital SEA B2B ASEAN 7 Minutes
Cocoon Capital: Backing Southeast Asia’s Quiet B2B Revolution
From AI-powered stroke diagnostics to pharma distribution and SME payment rails, Cocoon Capital backs the “invisible” infrastructure powering Southeast Asia’s next wave of growth. This Investor Spotlight unpacks their B2B and deep-tech thesis, how they invest, and the founders they champion. -

Tourism Travel SEA Tech 5 Minutes
Yacht Me Thailand: Digital Yacht Charter Platform for a Fragmented Market
Yacht Me Thailand is digitising yacht and boat charters across Thailand’s top marine destinations. With operator-first tools, sustainability at its core and ambitions to become a regional boating OTA, the platform is emerging as a notable travel-tech and marine tourism play. -
Fintech AI Startups Early Startups SEA 4 Minutes
The Dip in SEA Fintech Funding: What Startups Can Learn
SEA fintech funding has dipped, but capital is still on the field for disciplined teams. This article unpacks what the new funding rules look like and how founders can upgrade models, governance, monetization, and capital stacks. Learn where investor expectations have shifted and how WOWS Global can help you get raise ready. -

Series B Singapore SEA India 5 Minutes
Iron Pillar: Scaling India-Built Tech Into Southeast Asia
Iron Pillar is a venture-growth firm backing India-built technology as it scales across Southeast Asia. This spotlight covers stage focus, typical checks (US$5–15M), sectors, SEA go-to-market via Singapore, and notable portfolio patterns in SaaS and platforms. For founders and co-investors, it’s a practical guide to where Iron Pillar fits, and how to engage.